The warm temperatures we experienced today will have a brief reprieve this weekend as a low-pressure system to our south impacts our region. A disturbance forming in the Midwest will amplify off of the mid-Atlantic coast on Saturday before moving northeast. Plenty of cold air aloft from a cold front combined with a coastal storm could bring widespread snowfall accumulation from Philadelphia to Boston.
While temperatures aloft will be cold enough to support snow, they will remain close to the freezing mark. As a result, the snow will be wet and heavy, sticking to both tree branches and power lines. Heavy precipitation will begin on Saturday night and end early Sunday morning. This is a quick mover, so a majority of the precipitation will fall within a 12-hour timeframe.
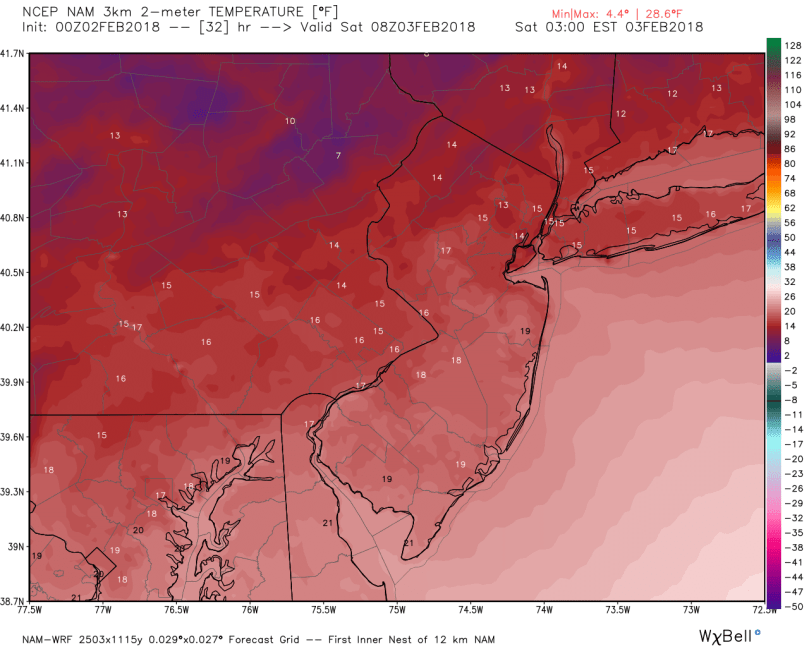
A major factor associated with this storm is the track. The further south the track, the higher chance that precipitation will fall as snow in the Delaware Valley. However, the models have been inconsistent. Shorter range models are showing colder solutions and the longer-range models are showing warmer ones. The map below is from short-range North American Model (the NAM):
If the NAM is correct, 4-6 inches of wet snow could accumulate along the I-95 corridor. As evidenced by the map, the rain/snow line is only 50-100 miles south of Philadelphia. Any slight shift northward of the track could have a significant impact on snow totals, especially south and east of the city.
The GFS model’s solution shows the possibility of mixing in Philadelphia and areas south:
With this solution, 1-2 inches of snow will fall with higher totals north and west of I-95.
Regardless of the precipitation type, expect a nasty Saturday night and Sunday morning, with frigid temperatures and heavy rain/snow (depending on the track of the storm).
In the longer term, a ridge in the jet stream will set up behind this system, bringing temperatures 25-30 degrees above average! A follow-up post reviewing this warmth and long-range forecast will be published this weekend.
February is opening to an active weather pattern for our region. Over the next 7 days, we will likely be impacted by three different storm systems. During this period, temperatures will be slightly above average as shown by the European anomaly map below:
Euro 7 Day Anomaly
As the anomaly shows, we are currently in a transition from a negative to positive PNA. What this means is that our reprieve from the cold is likely temporary. Additionally, the Arctic Oscillation is forecast to go negative around the 10-day timeframe. This usually indicates a colder airmass entering the continental US:
AO Forecast
7-Day Pattern
Until then, we have four storms to worry about! The first is arriving tonight into tomorrow. This is a system associated with a cold front moving across the Northeast. Temperatures were in the 40s today, but will rapidly drop tonight into tomorrow morning. I expect the rain to eventually change briefly over to snow overnight before moving off the NJ coast. The map below shows the high-resolution model forecast at 3 AM Friday:
NAM high-res 3 AM Friday
Tomorrow morning’s commute could be slick as wet roads freeze over once the front pulls through. Temperatures will drop during the day on Friday before plunging into the teens with wind chills into the single digits:
Storm #2 will quickly follow the first, forming rapidly during the day on Sunday. This system has characteristics of a coastal, phasing with a northern piece of energy over the great lakes. Models are currently projecting a quick phase, which would push the storm further west and keep our temperatures above freezing. Super Bowl Sunday will likely be a drencher as this storm barrels through the region Sunday evening. Any celebrations following the game (knock on wood!) will be cold and wet, with temperatures around 40 degrees.
Rainstorm Super Bowl Sunday
Storm #3 is looking like a classic “Appalachian runner.” The storm will form over Missouri next Tuesday before moving Northeast along the Appalachian mountain range. This atmospheric setup will steer the storm to the west and warm up our region. Temperatures could reach the 50s on Wednesday as the storm pulls through.
Our pattern continues to be active following this storm, with another system impacting the region next Saturday.
Following a very short January thaw, winter is returning this week with both ample cold air and a storm.
Clipper/Coastal Forecast
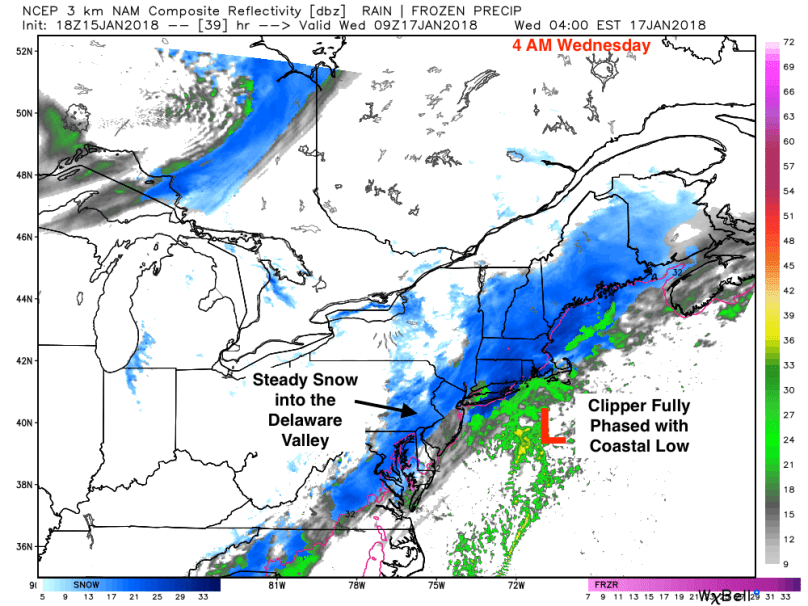
An Alberta clipper is moving down through the great lakes region and will phase with a piece of energy off of the Atlantic coast late Tuesday night. As the clipper moves eastward, it will bring a period of snow tomorrow evening into Wednesday morning for much of the region. Depending on the timing of the coastal phase, areas north and west of Philadelphia could receive substantial snowfall from this system. The map below shows the radar tomorrow at 7 PM. According to this model (the NAM hi-res), as the clipper begins to phase with the coastal low, a broad swath of snow enhances over Central and Eastern Pennsylvania:
Clipper Phasing with Coastal
By early Wednesday morning, the phase is complete, with a full coastal storm strengthening off of New England. At this point, a wide area of heavy snow will form over New England and will extend down to Virginia:
Clipper Phased with Coastal
As with many atmospheric phases, forecasting storms like this can be difficult. A slightly earlier or later phase would significantly alter the forecast for the I-95 corridor. Based on what I’ve observed from the forecast models, 5-8 inches will likely accumulate from the Poconos into New England. Most of the major cities, Philadelphia included, should receive 2-4 inches of light, fluffy snow.
Snow will likely begin after the evening rush on Tuesday in the Delaware Valley. In areas north or west of Allentown, I would advise preparing for a significant snowstorm tomorrow into Wednesday. Wednesday morning’s commute will likely be slick as the storm begins to move out.
The storm appears to be taking a more western path, which means the heaviest of snow will push into the I-95 corridor late tonight into tomorrow afternoon. Storm totals will range from 4 inches NW of 95, 8 inches from Philly to NYC, and possibly over a foot near the coast. As with most nor’easters, there will be areas with locally higher snow amounts. The map below illustrates forecasted snow totals. Note that ratios will be higher than 10:1 in this storm, so a 10:1 snowfall map showing 5 inches will more likely be 6-7 inches with this storm:
NAM Snow Prediction
Another concern with this storm is the wind. Wind speeds will approach 30 mph tomorrow morning as the storm bombs off the coast. There is a potential for scattered power outages from fallen tree branches.
Stay safe everyone and enjoy the snow!
Original Post
Happy New Year everyone! Hope your holidays were both relaxing and fulfilling.
In the weather…
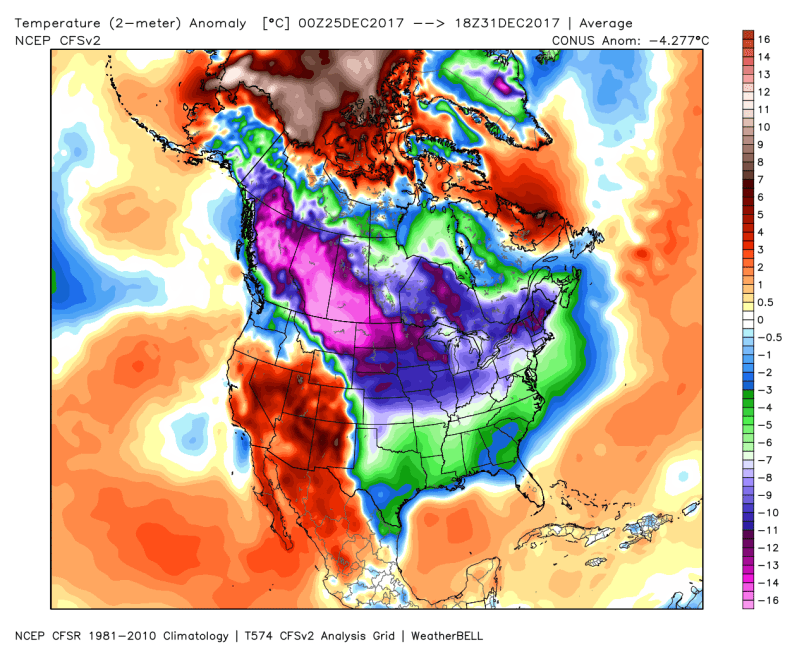
We are currently in the middle of what will likely be the coldest late December/early January period in recent memory. The map below shows the temperature anomalies from last week. Apart from the west, the nation was at least 6 degrees below normal with northern areas exceeding 10 degrees below normal.
US surface temperature anomalies Dec 25-31
The cold isn’t going away anytime soon. After the nor’easter moves through on Thursday, a high-pressure system will settle to the northwest this weekend, bringing even colder temperatures. Based on forecasted anomalies, we could see low temperatures well below 0 in New England and close to 0 from Philadelphia to NYC.
Temperature anomalies late Saturday night
Following the arctic blast this weekend, temperatures will likely return to normal or slightly above normal. However, more cold blasts are ahead, so stay warm over the next couple weeks!
Upcoming Nor’easter
The upcoming storm has all the features of a classic nor’easter. The actual system has actually already started to spin up in the Gulf of Mexico and will strengthen off the Atlantic coast tomorrow afternoon. Once the storm gathers strength, it will begin to move northeast and continue to strengthen.
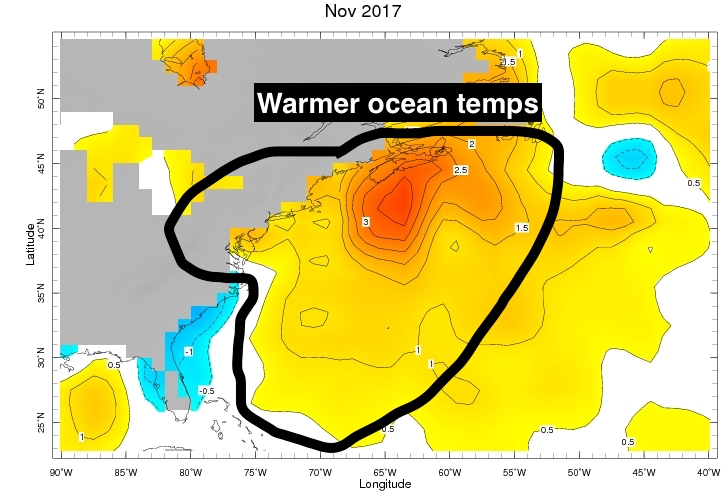
There are a few factors that favor the development of a significant nor’easter. First, ocean temperatures in the Atlantic are above normal for this time of year. This promotes faster and stronger development. Below is a map showing the Atlantic warmth:
Above Average Ocean Temperatures
Second, the current state of the teleconnections indicates conditions for storm development. The NAO will be transitioning to negative during the storm, the PNA remains strongly positive (trough in the east), and the EPO is negative. Finally, there is plenty of cold air feeding into the storm, creating blizzard conditions in some regions.
We know a storm is coming, but where and when? Right now, the nor’easter is projected to track up the coast late Wednesday and strengthen rapidly as it moves north on Thursday. The latest forecast models show the worst of the storm impacting New England with most of the heavy snow occurring east of the NJ coastline.
Thursday Morning Storm Track
By Thursday evening, storm’s low pressure will be the equivalent of a category 3 hurricane. Blizzard conditions will be occurring in much of New England while the light snow ends in the Delaware Valley:
Nor’easter Peak Strength
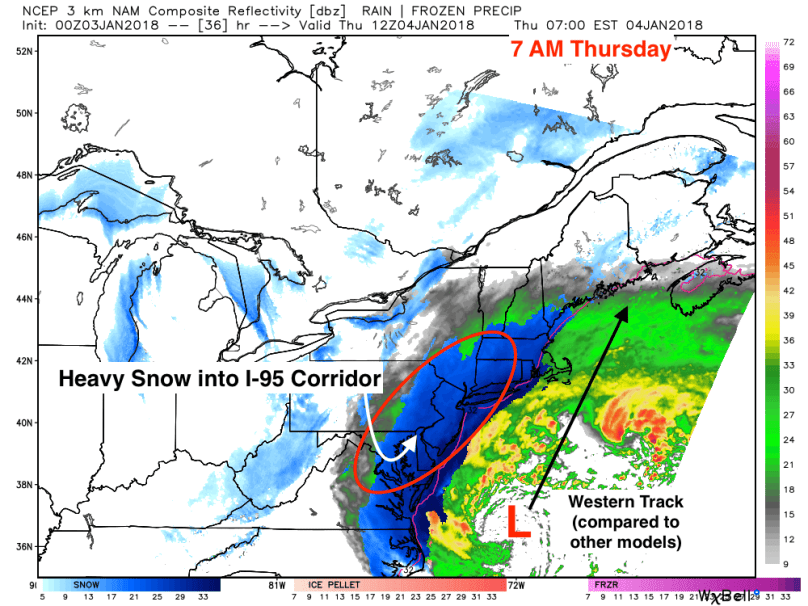
With all this being said, recent short term models have been trending slightly west. The ramifications for more westerly track could be significant in our region. As shown on the 3K NAM, a model that specializes in short range forecasting, a track even 75-100 miles west could bring heavy snows into the I-95 corridor:
3K NAM 7 AM Thursday
It is apparent there is still uncertainty associated with this nor’easter. We are currently 36 hours before the beginning of the event, which means the next 12-18 hours are critical in determining the actual track of the storm.
Based on recent data, it would be reasonable to expect a disruptive storm on Thursday. If the storm takes a more easterly track, 1-4 inches of snow should fall from this storm with more near the coast and less NW. If the storm takes a western path as shown in the 3k NAM above, 6-10 inches of snow would not be unreasonable.
If there are any changes overnight, I will post a quick update with a revised forecast tomorrow morning.
Hello dedicated followers! It has been an astonishing 687 days since my last post! While I could delve into what has happened since then (Hurricane Hermine, Hurricane Matthew’s impacts on the outer banks, 2016 being the warmest year on record, California’s historic drought followed by historic flooding, Hurricane Harvey, Hurricane Irma, Hurricane Maria, and the recent wildfires in California), it would probably take another 687 days to complete a comprehensive overview (with a separate addendum on Trump and the tragedy that is the EPA). So instead, I will start out with an educational article on one of the most essential tools of meteorological forecasting: teleconnections.
Posts on real weather in the Delaware Valley will begin tomorrow, and I will attempt to post at least weekly in perpetuity. Also, enjoy the new and improved look, and feel free to send suggestions!
Onto the teleconnections!
Teleconnections quantify changes in the atmosphere that can have wide-ranging effects on the global climate. Each of the following teleconnections is used by forecasters to determine weather patterns across the world. While all teleconnections measure different elements ranging from mid-level atmospheric changes to water temperature anomalies, all are very interconnected. As a forecaster, it is critical to not only understand the dynamics of each teleconnection but also the relationship between them.
El Niño Southern Oscillation (ENSO) – This is the El Niño/La Niña that everyone knows and loves! The ENSO is the most extensively studied teleconnection and has a significant impact on global climate. The ENSO is a variable pattern in the tropical region of the Pacific ocean. When this area of the Pacific is warmer than average, it’s called an El Niño (positive ENSO). A colder Pacific is represented by the La Niña (negative ENSO). The ENSO’s impacts on the globe are significant but not well understood. We know stronger El Niños are accompanied by warmer temperatures in the US (think 1997-1998 and 2015-2016). However, La Niñas, neutral ENSO periods, and weaker El Niños have more localized effects. For the northeastern seaboard, only the El Niño has a clear correlation with our weather (warmer when strong, snowier when weak).
North Atlantic Oscillation (NAO) – The NAO is determined by the differences in pressures over northern latitudes and central latitudes of the North Atlantic. When the NAO is positive, the northern latitudes have lower pressures than the central latitudes. The opposite is true when the NAO is negative. The NAO is one of the most important teleconnection patterns used by forecasters because of its impacts on the jet stream, especially in Europe and North America. A negative NAO means a colder and snowier period for our region. A negative NAO transitioning to neutral or positive generally indicates an incoming snowstorm.
Eastern Pacific Oscillation (EPO) – Similar teleconnection to the NAO, except located in the Pacific. When the EPO is negative, pressures in the northern latitudes are higher than the southern ones. A positive EPO is the opposite. A negative EPO generally corresponds to a cooling period in the eastern US.
Arctic Oscillation (AO) – Determined by opposing pressure patterns in the middle and high latitudes of the Northern Hemisphere. A negative AO occurs when there’s higher pressure over the polar region and lower pressure in the mid-latitudes. The opposite occurs during the positive phase. The AO is an excellent indicator of the track of storms and the location of cold air. With a negative AO, the higher pressure over the poles allows more cold air to drop into the mid-latitudes (continental US).
Madden Julian Oscillation (MJO) – The MJO is represented by an eastward tracking wave that travels across the planet. The cycle of the MJO lasts 40-60 days and is represented by 8 different phases. Each stage can have a disparate impact on temperature patterns in the US and is a predictor of tropical activity. In the winter months, the effects of the MJO on the east coast are generally not well understood (although it is thought phases 1 & 8 promote coastal storm development)
Pacific-North American (PNA) – The PNA is a prominent mode of low-frequency variability in the Northern Hemisphere. It measures the pattern of 500 mb height anomalies. 500 mb is a measurement of the pressure in the middle of the atmosphere. It is extremely useful in determining the locations of pressure systems and identifying patterns in the middle latitudes (30 to 60). The location of the PNA is determined by a quadripole ranging from the southeastern US to the Aleutian islands in Alaska. A positive PNA is represented by ridging in the west (above average 500 mb pressures) and troughing in the east (below average 500 mb pressures). It is also represented by above average temperatures in the west and below average temperatures in the east:
A negative PNA is characterized by the opposite pattern:
Hi all, hope everyone had a nice weekend. A complex and extremely difficult to forecast inverted trough will form tomorrow, creating snowy conditions tomorrow afternoon into Wednesday morning.
The setup:
As of Monday morning, an extremely powerful low pressure system is moving up the coast, affecting areas of New England. As this low pressure moves away, a clipper will enter the area late tonight and transfer it’s energy off the coast. As this transfer occurs, a rare phenomenon known as the Norlun Trough will form. The trough is an interaction between the weakening low pressure in Ohio and western PA and the strengthening one off the coast. The North American Model depicts this interaction in the 500mb image below:
Referring to the image above, the Norlun Trough will likely setup somewhere along the turquoise arrow I drew to illustrate the interaction between the lows.
Forecasting the Trough:
I will be completely honest here: the Norlun Trough is a forecaster’s nightmare. The models have been historically bad at determining the location of the trough, since we still do not completely understand the atmospheric factors that drive the transfer of energy between the low pressures. That being said, from the data and information I have, it is looking likely that the trough will setup a little south of Philadelphia.
The NAM 4KM is one of the better short range simulated radar models. As you can see in the above image, the trough parks itself over the area for a prolonged period of time tomorrow evening into early Wednesday morning. Even though the event is a little over 24 hours away, there is still lots of uncertainty to where the trough will setup. If the interaction occurs 100 miles south or north, no snow would fall in Philadelphia.
My forecast:
For areas north of the city, less snow will fall: 2-4 inches
For areas West and South of the city, more substantial snowfall is likely: 4-8 inches
There will also be banding during this storm, meaning that there might be places that receive locally higher amounts in excess of 8 inches.
A major blizzard will affect most of the Eastern seaboard starting tonight into Sunday morning. This storm will rival the 1996 blizzard in terms of intensity and snow totals. Blizzard warnings have been posted by the national weather service for many areas, including Washington DC, Baltimore, Philadelphia, and New York City. This blog post will overview the storm in three sections: snow and timing, wind, and recommendations.
Snow:
Currently, our storm is gaining strength in the southeast. Snow is currently falling in Virginia, Tennessee, and Kentucky. The low pressure is moving northeast and will exit off the Atlantic coast sometime Saturday morning. Light snowfall should start at around 10 PM tonight and progressively become heavier by Saturday morning. The image below of the 4K NAM shows steady snow moving into the region late tonight and early Saturday morning. As the low pressure moves off of the coast, it will strengthen further and the the wind and snow will pick up during the day on Saturday. Snowfall rates of 1-2 inches an hour are very likely from 10 AM to 6 PM on Saturday as the storm moves into open water. The 4k NAM image below shows the snow in the area becoming heavy tomorrow morning:
As we head through the day Saturday, a lull is likely as the storm’s initial precipitation shield moves off the coast. This lull will occur during the afternoon or early evening on Saturday. By nighttime, the snow will pickup again and blizzard conditions will prevail until early Sunday morning.
By Sunday morning, the snow should slow down and eventually end from west to east.
Totals:
Forecast models have projected snowfall totals ranging from 1 foot to over 2 feet. My forecasted totals are a blend of multiple models and are shown below:
As the snow map shows, we are in for a snowstorm of historic proportions. Areas in Virginia and Maryland will receive the most snow, with some totals approach 3 feet! Our area will likely see totals 1-2 feet with locally higher amounts.
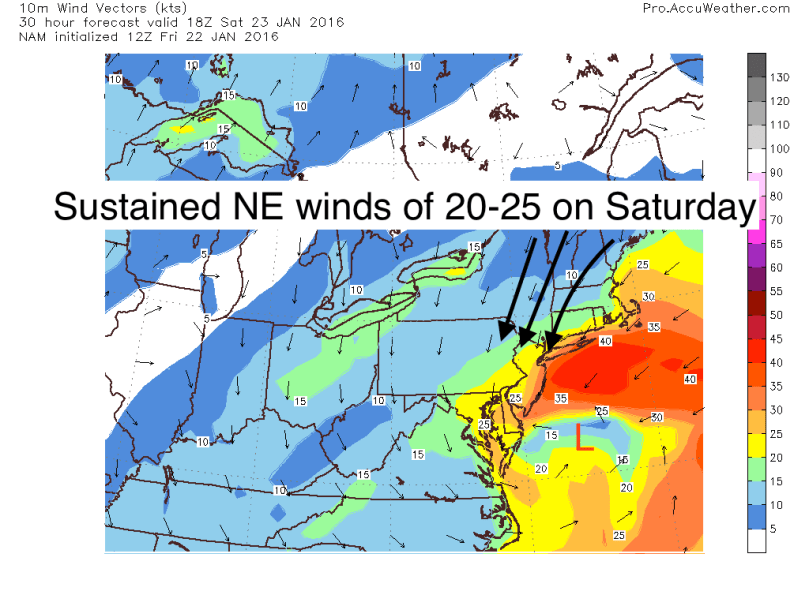
Wind:
Heavy snow is not the only factor of this storm. As the storm moves offshore, it will strengthen and bring in strong winds from the northeast (that’s why they call it a nor’easter). These winds will be strong, cold, and straight out brutal. At the peak of the storm, winds will be 20-25 mph with gusts up to 40. Along with the snow, it will create whiteout conditions on Saturday and Saturday night. Visibilities will be almost 0 and temperatures in the upper 20s. Additionally, there will be blowing and drifting snow, which will make it extremely difficult to clear the roads on Sunday.
Recommendations:
Please do not drive during this storm. With visibilities extremely low and heavy snow falling, travel will be nearly impossible on Saturday and even into Sunday. If you go outside during the storm, wear layers and make sure any exposed skin is covered. Travel will likely be limited into Monday as drifting snow and refreeze will cause issues early into next week.
Thanks all and don’t hesitate to comment with questions or concerns!
Hey everyone! I apologize for the scant number of posts during the past 9 months (zero as a matter of fact!), but Philaburbia is back for the rest of the winter season.
With a strong El Niño present, it’s been a very warm winter so far, with temperatures in Philadelphia running 13.7 degrees above normal in December. So far in January we are running around 2 degrees above normal. However, with El Niño beginning to weaken (see below) and arctic air starting to creep in, we are in for a stormy and colder February and March.
Ocean Temperatures:
It’s been a very quiet winter so far with no major coastal system running up the coast. This, however, will change Friday and Saturday as a coastal system with abundant moisture will strengthen off of the Atlantic coast. I’ve explained to friends and colleagues, our warm December and January has resulted in extremely warm ocean temperatures off the coast. With warmer ocean temperatures, a low pressure system can strengthen quicker through sources of evaporation (this is why we primarily see hurricanes during the summer months, when the oceans are warm). As you can see from the map below, ocean temperatures have been nearly 3 degrees above normal:
Teleconnections:
Additionally, projected teleconnections have signaled the likelihood of a large disturbance. Both the NAO and AO (atlantic and arctic oscillations) are both headed toward a neutral position, with the AO doing so rapidly, following the storm.
Atmospheric Setup:
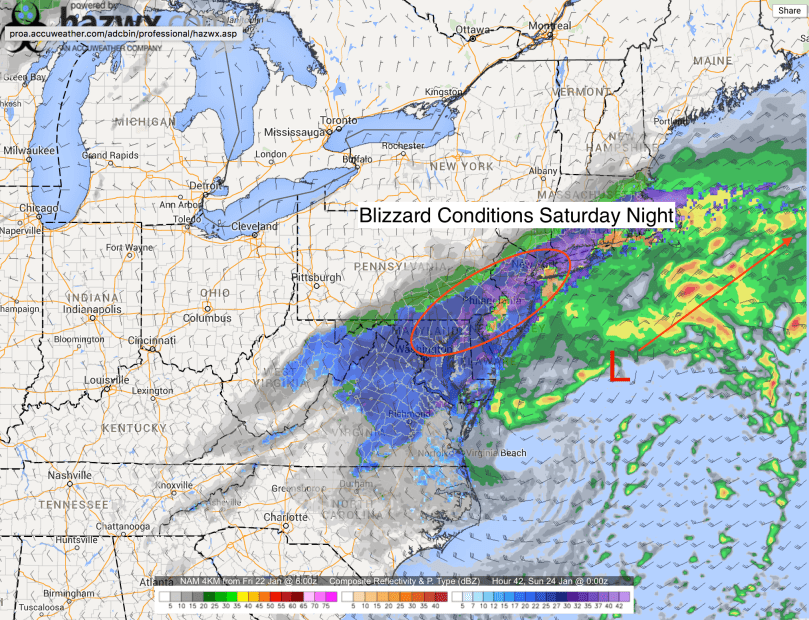
The atmospheric setup is also favorable in the days leading up to the storm. All models are projecting a Canadian high moving in to provide cold air aloft while the low pressure moves into a benchmark position off the coast. Where the uncertainty lies so far is the location of the storm formation in the southeast. This aspect of forecasting is extremely difficult, since we do not possess the instruments necessarily to accurately predict the location of storm initialization. This brings us to our two scenarios:
Two Scenarios:
GFS, Canadian: Storm moves exits coast at Virginia, follows up the benchmark and stays close to the coast. In this scenario, areas in Maryland would receive the most snow with other areas like Philly, NYC, and Boston all receiving over a foot of snow as well. This solution is shown below:
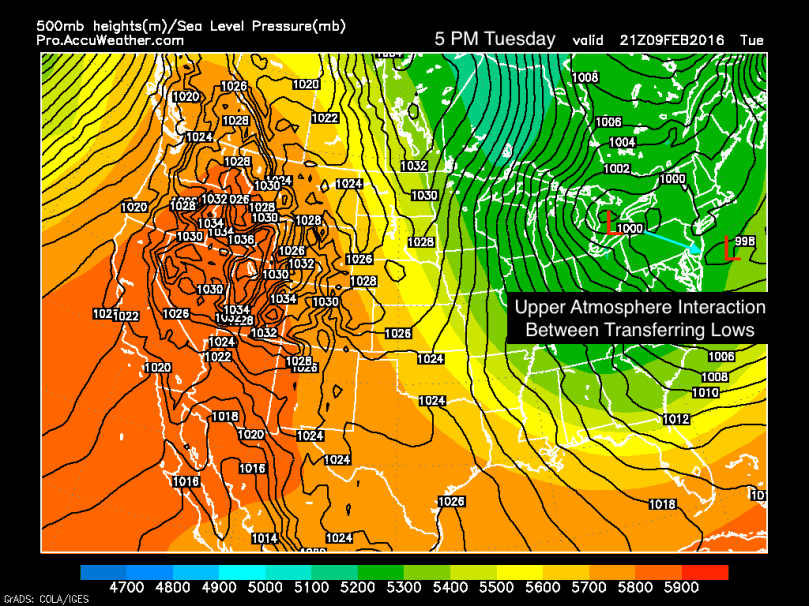
2. EUROPEAN: Instead of exiting the coast off of Virginia, the storm will slide further south and strengthen more quickly than anticipated before moving Northeast, away from land. While this scenario still projects a strong nor’easter, most of the heavy precipitation will be located off the coast. In the Philadelphia region, we would still receive a plowable snowfall, but nothing close to the 1-2 feet projected in scenario 1. The european is pictured below, courtesy of Accuweather:
Timing:
For both scenarios, the timing will be from Friday night into early Sunday morning. The major snowfall will occur during the day on Saturday. If scenario 1 plays out, we could see a prolonged period of 1-2 inch/hour snowfall rates Saturday afternoon. By midnight on Sunday, most of the snow should be finished with some scattered snow showers moving out by 3 AM on Sunday.
Regardless of which scenario is correct, this storm will be disruptive. I would advise against traveling at all from Friday night to Sunday morning until roads are cleared.
More updates coming with a final forecast on Thursday. It’s nice to be back.
I am currently tracking a disturbance associated with a stalled front which will pass through the region tonight into tomorrow. This system will be moisture-rich and will have plenty of cold air associated with it. While the event is less than 24 hours away, there is still some uncertainty concerning where the front will stall. If it stations itself further south, this means less snow for areas around I-95 and more snow for South Jersey and Delaware. If the front stalls further north, more of the Delaware Valley will receive significant snows.
The timeline of this storm will also be prolonged. Throughout the day today, it will be rainy and “warm”. As the front progresses south, temperatures will slowly fall to freezing. At this point, the rain should change to snow. The snow should start to fall by 1 AM tonight and continue throughout the day tomorrow until slowing down and ending by around 6-7 PM. Since snow will be falling for an extended period, totals will be significant.
GFS Model 8 AM Thursday
Many models are projecting a general 6-9 inches falling for the immediate suburbs with slightly higher totals possible in South Jersey. The effects on the roads will be serious tonight and tomorrow. I would strongly recommend against driving tomorrow unless it is absolutely necessary.
Snow Map for Early March Snowstorm
That said, the snow will not last long after the storm ends. The March sun angle (equivalent to late September at this point) will quickly melt the snow. Roads should be fine by Friday and most of the snow could be melted by the end of next week.
A note about February: February was one of the coldest months we have seen on record. In Philadelphia temperatures were 10 degrees below normal. The last time we hit a high temperature above normal was on February 8th when we reached 51 degrees! The brutal February pattern should regress as we head into March, but will likely not completely disappear if long-range models are correct. Overall, I expect March to be around 3-4 degrees below normal, which is still an improvement over February.
It is going to be an extremely eventful next 72 hours for the region and the northeast as a whole.
As a mentioned in my last post, a small clipper system will pass through the area late tonight and tomorrow. This storm has the stereotypical features of a clipper: plenty of cold air, fluffy snow, a general 2-4 inches for most. Precipitation will start falling late tonight and continue throughout the day tomorrow.
NAM Model Monday
At this point, the situation gets complicated. After the clipper exits the coast, it will interact with a weak disturbance off the Atlantic coast and strengthen rapidly into a nor’easter. Plenty of moisture will be fed into the storm from the ocean, and plenty of cold air will be present as well. The question that remains is where and when this storm will strengthen. Models have been a little inconsistent with the timing of the phase and where it will occur. The further west the storm phases, the more snow we will receive in the Philadelphia area. In New York City and Boston, blizzard conditions will be likely.
Model Analysis:
European: The European has been the aggressive model for this storm. Most of the solutions it shows bring the storm close to the coast and drop 10-15 inches of snow with totals higher in New Jersey and areas closer to New York.
European Model
GFS: The GFS model has been the more conservative model, showing a slower phase further east than the European. It’s latest runs have been having convective feedback issues, however, which means it’s solution may not be accurate. Until these issues are resolved, I will not be favoring this model when making my forecast.
NAM: The North American Model is the middle ground between the two previous ones. It is projecting 8-12 inches falling by Wednesday morning. I am favoring this model the most out of the three because of its increased accuracy in the short run.
NAM Model
Timing :
12 AM-6 AM Monday: Snow will start west to east
6 AM- 6 PM Monday: Snow accumulating a general 2-4 inches during the day
6 PM Monday- 2 AM Tuesday: Light Snow as storm strengthens off of coast
2 AM – 5 PM Tuesday: Snow. Heavy at times. Accumulating 5-8 inches (or more depending on location of storm off coast)
5 PM Tuesday – 3 AM Wednesday: More snow, eventually tapering off late night on Tuesday
The official Forecast:
While the clipper forecast is fairly straight forward, the following nor’easter involves many dynamic components which need to be ideal for a major snowstorm to occur in the Delaware Valley. Even though these conditions are favorable, there is still some uncertainty in the exact amount of snow we will receive by Wednesday morning. Temperatures will be in mid-20s, which means a light fluffy snow will fall. These low temperatures also increase the snow to precipitation ratio, which means snow will accumulate faster than normal.
The snow map below shows totals from the clipper and the nor’easter combined. Depending on the formation of the low off the coast, the 10-14″ area is subject to shift in the next day or two. Overall, 6-10″ inches is good bet for the city and areas south and west. Totals will be higher closer to NYC and even higher near Boston, where blizzard conditions will likely occur.
Snow Map for the One Two Punch
Effects on travel will be significant on Monday and Tuesday. Businesses and schools will be shutdown on Tuesday, and I wouldn’t count out some cancellations on Monday as well. Stay off the roads and be safe. More


 Referring to the image above, the Norlun Trough will likely setup somewhere along the turquoise arrow I drew to illustrate the interaction between the lows.
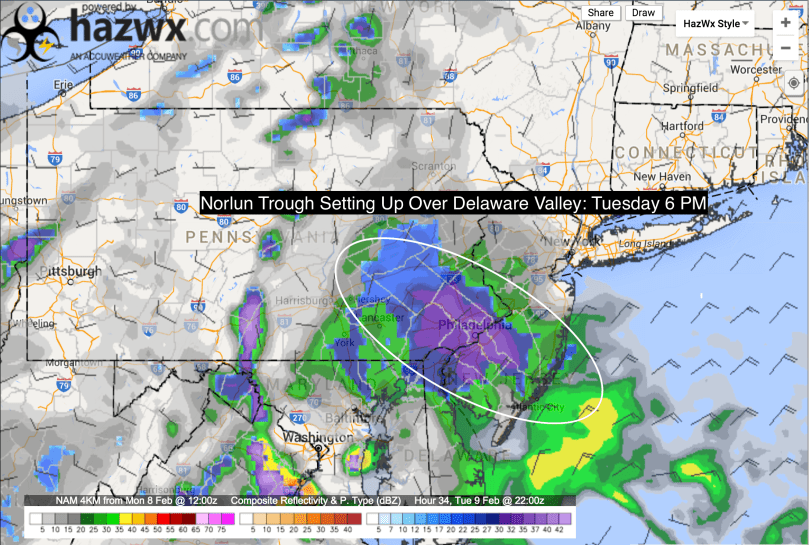 The NAM 4KM is one of the better short range simulated radar models. As you can see in the above image, the trough parks itself over the area for a prolonged period of time tomorrow evening into early Wednesday morning. Even though the event is a little over 24 hours away, there is still lots of uncertainty to where the trough will setup. If the interaction occurs 100 miles south or north, no snow would fall in Philadelphia.
 As the low pressure moves off of the coast, it will strengthen further and the the wind and snow will pick up during the day on Saturday. Snowfall rates of 1-2 inches an hour are very likely from 10 AM to 6 PM on Saturday as the storm moves into open water. The 4k NAM image below shows the snow in the area becoming heavy tomorrow morning:
 By Sunday morning, the snow should slow down and eventually end from west to east.
 Recommendations:


